

Table of Contents
Introduction
At UserX, amidst the vast sea of results and the extensive volume of statistics available in the realm of mobile app development, our focus has been keenly tuned towards two pivotal aspects: user engagement and app performance. These facets are not just mere metrics; they are the cornerstones of successful app experiences, encapsulating the essence of how users interact with and perceive mobile applications. In a landscape continuously reshaped by technological advancements and changing user preferences, understanding these elements becomes critical. It's not just about quantifying user interactions, but about delving into the qualitative aspects that define the user experience. As we sift through the myriad of data, our aim is to distill the essence that truly matters to app developers and marketers alike - how to captivate users and optimize app functionality to not just meet but exceed user expectations. This journey into the intricacies of user engagement and performance is not just a pursuit of data but a quest to uncover the trends and strategies that will define the future of mobile app development.
| Year | Number of Smartphone Users | Growth Over the Previous Year | Percentage Growth Over Previous Year |
|---|---|---|---|
| 2016 | 3.668 billion | – | – |
| 2017 | 4.435 billion | + 767 million | + 20.91% |
| 2018 | 5.095 billion | + 660 million | + 14.88% |
| 2019 | 5.623 billion | + 528 million | + 10.36% |
| 2020 | 5.924 billion | + 301 million | + 5.35% |
| 2021 | 6.259 billion | + 335 million | + 5.65% |
| 2022 | 6.567 billion | + 308 million | + 4.92% |
App user behavior in 2023
As we navigate through 2023, the realm of mobile app usage reveals a range of interesting trends. These developments are significantly altering the ways in which we use our smartphones and interact with various applications. Here, we delve into a brief overview of these trends, which highlights the ongoing evolution in the patterns of smartphone usage.
- Frequency of App Usage: A significant portion of smartphone users, about 51%, check their apps between 1-10 times daily. This is followed by 25% who check their apps 11-20 times, 16% checking 21-50 times, and a smaller group, 7%, checking over 51 times each day. This data indicates varying levels of app engagement among users.
- Time Allocation on Apps: A whopping 85% of the time spent on smartphones is dedicated to using apps. Facebook and Google lead the pack, accounting for 13% and 12% of US app usage, respectively.
- Demographics of Smartphone Users: In the United States, the typical smartphone user skews male, with a majority of both males (80%) and females (75%) being in the 18-29 age bracket.
- Patterns in Phone Checking and Usage: On average, Americans check their phones every 10-12 minutes, totaling about 96 times a day. Daily phone usage typically amounts to a minimum of 5 hours.
- Trends in App Downloads and Uninstalls: Surprisingly, 62% of smartphone users prefer not to download an app for transactions, and of those who do, half uninstall the app post-transaction.
- App Conversion Rates: Interestingly, users spend seven times more time on apps than on browsers, which correlates with higher conversion rates on apps compared to mobile websites.
- Revenue from App Stores: The revenue numbers are staggering - the Google Play Store garnered approximately $10.4 billion in gross app revenue, while the Apple App Store doubled that figure with $21.2 billion in Q3 2022.
- Most Popular App Categories: Dominated by gaming, the App Store categories show a clear preference among users. However, it's crucial for apps to align with their primary purpose for categorization.
- App Engagement and Churn Rates: A notable 78% of mobile app users in the US use five or fewer apps daily, and a high churn rate is observed with 71% of global app users discontinuing app usage after 90 days.
- Effectiveness of Push Notifications: Push notifications have been found to significantly increase user retention, with an average 5x increase in mobile app user retention.
- Global App Usage Trends: The global number of mobile app users is expected to hit 7.26 billion by 2023. TikTok led the charge as the most downloaded app globally in the previous year.
This overview paints a vivid picture of how mobile apps are being used in 2023, highlighting the significant role they play in our daily digital interactions.
Most Popular iOS Apps in 2023
| App | Downloads (Million) |
|---|---|
| TikTok | 212 |
| YouTube | 133 |
| 127 | |
| CapCut | 113 |
| 103 | |
| GoogleMaps | 98 |
| Google One | 89 |
| Kwai | 78 |
| Snapchat | 75 |
| 75 |
Most Popular Android Apps in 2023
| App | Downloads (Million) |
|---|---|
| TikTok | 460 |
| 455 | |
| 297 | |
| Snapchat | 255 |
| CapCut | 244 |
| Telegram | 244 |
| 223 | |
| Subway Surfer | 198 |
| Messenger | 167 |
| Stumble Guys | 158 |
Top Mobile App Activities
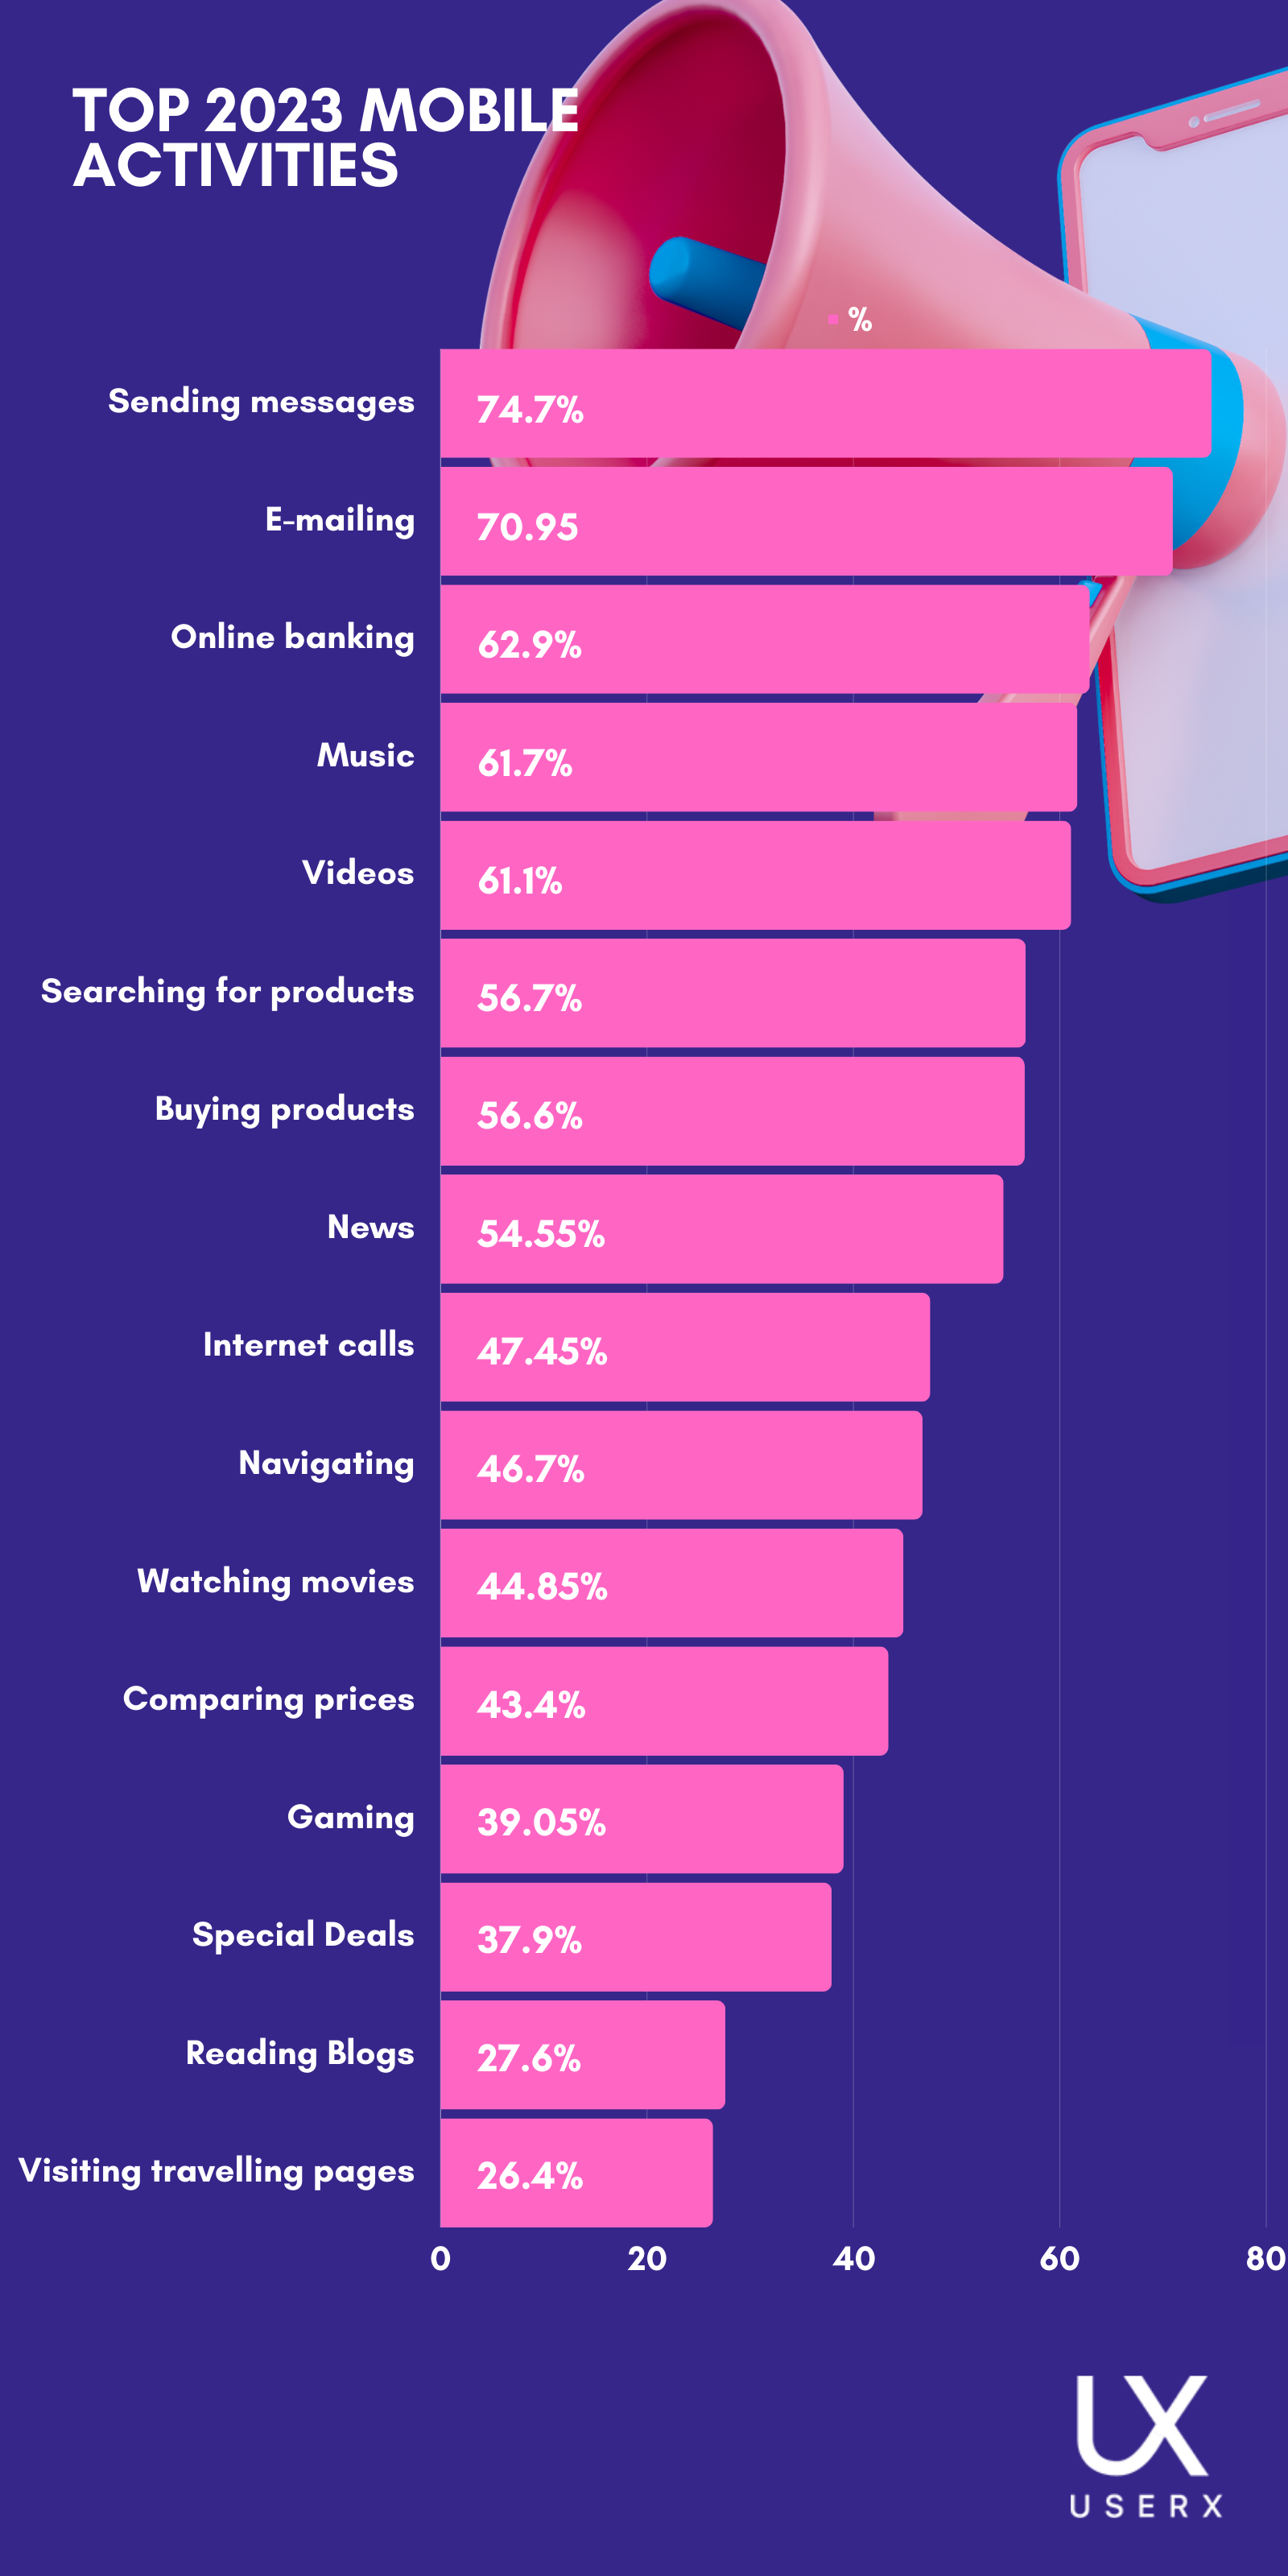
Source: RipenAps
Mobile App Performance in 2023
In the realm of mobile apps, the performance and popularity dynamics between iOS and Android platforms, as well as user behaviors and market trends, offer an intriguing study. Here's an original synthesis of these aspects, drawing from multiple sources for comprehensive insights:
- Comparative Performance of iOS and Android Apps: When examining the stability of apps across platforms, iOS apps generally show a higher stability rate. Notably, they have a median crash-free rate nearing 99.93%, while Android apps hover around 99.81%. This disparity largely stems from the vast heterogeneity in Android's device ecosystem and OS versions, posing challenges in achieving uniform app performance.
- Challenges in Mobile Gaming App Performance: On both Android and iOS, mobile gaming applications face significant hurdles, particularly in memory usage. A considerable proportion of gaming sessions on these platforms encounter memory-related warnings, surpassing the average for other app categories. This underlines the resource-intensive nature of mobile games.
- Efficiency of Delivery Apps: In the competitive sector of delivery services, apps are achieving commendable performance metrics. They exhibit notably high rates of stability and encounter fewer memory issues compared to apps in other sectors. This efficiency is likely driven by the critical need for reliability in the delivery app market.
- Popular Categories Across App Stores: Gaming apps continue to dominate in popularity across both major platforms, with other categories like education and business also holding substantial market shares. This diversity reflects the broad range of user interests and needs catered to by modern app stores.
- Key Performance Metrics in App Analysis: Understanding app performance and user engagement hinges on tracking key metrics like Average Revenue Per User (ARPU) and user activity indicators such as Daily and Monthly Active Users (DAU & MAU). These metrics are instrumental in deciphering user behaviors and the financial health of apps.
This overview encapsulates the complex and dynamic landscape of mobile app performance, highlighting how various factors such as platform, app category, and user demographics interplay to shape the current mobile app ecosystem.
Mobile App Development Trends in 2024
As we look ahead to 2024, the mobile app development landscape is poised for exciting changes and innovations. Here are some key trends to watch out for:
- Voice Technology Integration: The integration of voice technology in mobile apps is becoming increasingly prevalent. With the rise of virtual assistants like Siri and Alexa, users are becoming more accustomed to voice-enabled interactions. This trend is not just limited to controlling smart homes or devices but is expanding into various app functionalities, enhancing user experiences significantly.
- Augmented Reality (AR) and Virtual Reality (VR): AR and VR technologies are rapidly being adopted in mobile app development. These technologies are extending beyond gaming into various industries, offering immersive and interactive experiences. For instance, apps like Ikea’s Furniture Preview and Google Maps’ Live View are utilizing AR for practical and engaging user experiences.
- M-Commerce Growth: The mobile commerce sector has seen a significant boost, particularly after the COVID-19 pandemic. With an increasing number of consumers shopping via mobile apps, this trend is expected to continue growing, with mobile e-commerce sales projected to reach substantial figures in the coming years.
- Wearable Tech Apps: The development of wearable tech apps is another trend gaining momentum. With major updates like Apple’s WatchOS 8 and collaborations like Google’s with Samsung for a unified wearables platform, the wearable device industry is evolving rapidly, offering numerous opportunities for app development.
- Beacon Technology: Beacon technology is enhancing the functionality of mobile apps in various fields, from retail to healthcare. This technology allows for proximity marketing, improving user experience within mobile apps. The beacon technology market is expected to grow significantly, showcasing its potential as a key trend in mobile app development.
- Super Apps: The concept of super apps, which integrate multiple services into one platform, is becoming increasingly popular. These apps provide a range of services from delivery and finance to entertainment, offering convenience and efficiency to users. The rise of super apps is a trend that's reshaping the way users interact with mobile applications.
- Enhanced App Security: With the growing reliance on mobile apps for daily activities, enhancing app security is becoming a top priority. This includes stronger measures like robust encryption, secure authentication methods, and biometric verifications to protect user data and build user trust.
- Mobile Commerce: The shift to mobile commerce is significant, with businesses of all sizes increasingly relying on mobile apps. The ease and convenience of mobile shopping are driving this trend, and digital wallets are expected to grow in popularity, simplifying the payment process for customers.
These trends highlight the dynamic and evolving nature of the mobile app development industry, underlining the importance of innovation and adaptability in this field. As we move into 2024, these trends are likely to shape the way businesses and developers approach mobile app creation and user engagement.
Mobile App Analytics Trends in 2024
In the evolving landscape of mobile app analytics for 2024, several key changes and enhancements are shaping how app performance and user engagement are measured and optimized. Here's an overview of the notable trends and improvements:
- Advanced Retention Analysis: Mobile app analytics are increasingly focusing on understanding user retention. This involves analyzing how many users return to the app after their initial visit, providing valuable insights into user loyalty and helping identify strategies to improve retention.
- Conversion Tracking and Funnel Analysis: Conversion tracking is becoming a crucial component, allowing developers to track specific goals or conversions within the app. Funnel analysis further aids in analyzing user behavior throughout a predefined conversion process, helping to identify bottlenecks and optimize the user journey for better conversion rates.
- Enhanced User Experience Analysis: Tools like UserX are offering robust mobile testing and heat mapping tools, including scroll maps, taps maps, session recording, and in-depth analytics. These tools are perfect for analyzing and improving the UX of mobile apps, either independently or in conjunction with other analytics tools.
- Qualitative Data Analysis: Qualitative mobile analytics software is helping developers find valuable customer insights, such as where users taps, which features they like, why they churn, and what bugs and glitches they experience. This software runs on various mobile platforms and frameworks, delivering accurate qualitative data.
- Comprehensive Mobile Analytics Platforms: Platforms like Google Analytics are providing in-depth insights into user behavior and interactions within applications. These platforms offer advanced analytics and unique insights to discover user trends and patterns in the data, helping to identify high-potential users and the most effective content.
- Use of AI for Enhanced Analytics: The integration of Artificial Intelligence (AI) in mobile app analytics is becoming more prevalent, allowing for smarter and more predictive analyses of user behavior and app performance.
These trends indicate a shift towards more sophisticated, data-driven approaches in mobile app analytics, focusing on both quantitative and qualitative aspects of user behavior and app performance. As a result, developers and marketers can make more informed decisions to enhance user experience, engagement, and ultimately, the success of their mobile apps.
FAQ
How often do smartphone users check their apps in 2023?
Approximately 51% of smartphone users check their apps 1-10 times daily. Another 25% check 11-20 times, 16% check 21-50 times, and 7% check more than 51 times each day.
What percentage of smartphone usage time is spent on apps?
A significant 85% of smartphone usage time is dedicated to using apps.
What are the demographics of smartphone users in the US?
The majority of smartphone users are male, with 80% of males and 75% of females being in the 18-29 age bracket.
What is the trend in app downloads and uninstalls for transactional apps?
Surprisingly, 62% of smartphone users prefer not to download transactional apps, and half of those who do, uninstall the app after completing the transaction.
How do app conversion rates compare between apps and browsers?
Users spend seven times more time in apps than in browsers, leading to higher conversion rates in apps compared to mobile websites.
What are the app engagement and churn rates in 2023?
About 78% of mobile app users in the US use five or fewer apps daily, and there is a high churn rate with 71% of global app users discontinuing app usage after 90 days.
What is the expected global number of mobile app users by 2023?
The global number of mobile app users is expected to reach 7.26 billion by 2023.
How do iOS and Android apps compare in terms of performance?
iOS apps generally exhibit a higher stability rate compared to Android apps. The median crash-free rate for iOS apps is about 99.93%, whereas for Android, it's around 99.81%. This difference is largely due to the diversity in Android's device ecosystem and OS versions.
What are the challenges faced by mobile gaming apps on iOS and Android?
Mobile gaming apps on both platforms encounter significant challenges in memory usage. A large proportion of gaming sessions experience memory-related warnings, indicating the resource-intensive nature of these games.
How is Conversion Tracking and Funnel Analysis changing in 2024?
Conversion tracking is evolving to allow developers to track specific goals or conversions within their apps. Funnel analysis aids in understanding user behavior throughout the conversion process, helping to identify and optimize bottlenecks for better conversion rates.
What enhancements are being made in User Experience Analysis?
Tools like UserX are enhancing user experience analysis with robust mobile testing and heat mapping tools. These include scroll maps, taps maps, session recording, and in-depth analytics, ideal for analyzing and improving the UX of mobile apps.
What role does Qualitative Data Analysis play in mobile app analytics?
Qualitative Data Analysis, offered by software like UserX, helps developers gain valuable customer insights such as user click patterns, feature preferences, reasons for churn, and bug experiences, providing accurate qualitative data across various mobile platforms.
What overall trends are seen in mobile app analytics for 2024?
The trends indicate a shift towards more sophisticated, data-driven approaches, focusing on both quantitative and qualitative aspects of user behavior and app performance. This evolution is expected to enhance user experience, engagement, and the overall success of mobile apps.
