


How does a business transform raw data into actionable insights to enhance user engagement and satisfaction? Enter the realm of the customer experience dashboard. This tool isn't just a collection of graphs and numbers; it's a strategic asset for making informed decisions that can profoundly impact customer satisfaction and loyalty. By integrating comprehensive data analysis and real-time feedback, a dashboard dedicated to customer experience offers a dynamic view of how users interact with your platform. It highlights areas of success and those needing improvement, allowing businesses to tailor their strategies for maximum impact. Through this lens, companies can understand the narrative behind the data, driving actions that foster positive customer relationships and growth.
A customer experience dashboard in mobile app analytics is a visual representation that aggregates and displays key data and metrics related to how users interact with a mobile application. This dashboard is designed to give businesses and app developers insight into the user's journey, preferences, behaviors, and feedback within the app. Here are several key components and metrics that are typically included in a customer experience dashboard:
- User Engagement Metrics: These include data on app session lengths, frequency of use, screens visited, and actions taken within the app. This helps in understanding how engaged users are with the app.
- Customer Satisfaction Scores: Metrics such as Net Promoter Score (NPS), Customer Satisfaction (CSAT), and Customer Effort Score (CES) can be included to gauge users' satisfaction levels with the app.
- User Retention and Churn Rates: Tracking how many users continue to use the app over time versus those who uninstall or stop using it provides insight into the app's retention capabilities and points to possible areas for improvement.
- User Feedback and Reviews: Integrating user feedback from app reviews, support tickets, and surveys directly into the dashboard helps in identifying common issues or requests, enabling quick action to enhance the user experience.
- Performance Metrics: Data on app load times, crashes, and other performance issues are crucial for understanding how technical problems may be affecting the customer experience.
- Conversion Rates: For apps designed with specific conversion goals (e.g., sales, sign-ups), tracking how effectively users are moving through the conversion funne is key to identifying bottlenecks or opportunities for optimization.
- Demographic and Behavioral Segmentation: Information on user demographics (age, location, device type, etc.) and behavior patterns can help in tailoring the app experience to meet the needs of different user groups.
By monitoring these metrics, businesses can identify areas where the app excels and areas where there is room for improvement. The goal is to use this data to make informed decisions that enhance the overall customer experience, leading to higher satisfaction, increased loyalty, and ultimately, better business outcomes. A well-designed customer experience dashboard is an invaluable tool in achieving these objectives, providing a comprehensive overview of how users interact with the app and highlighting areas for strategic improvement.
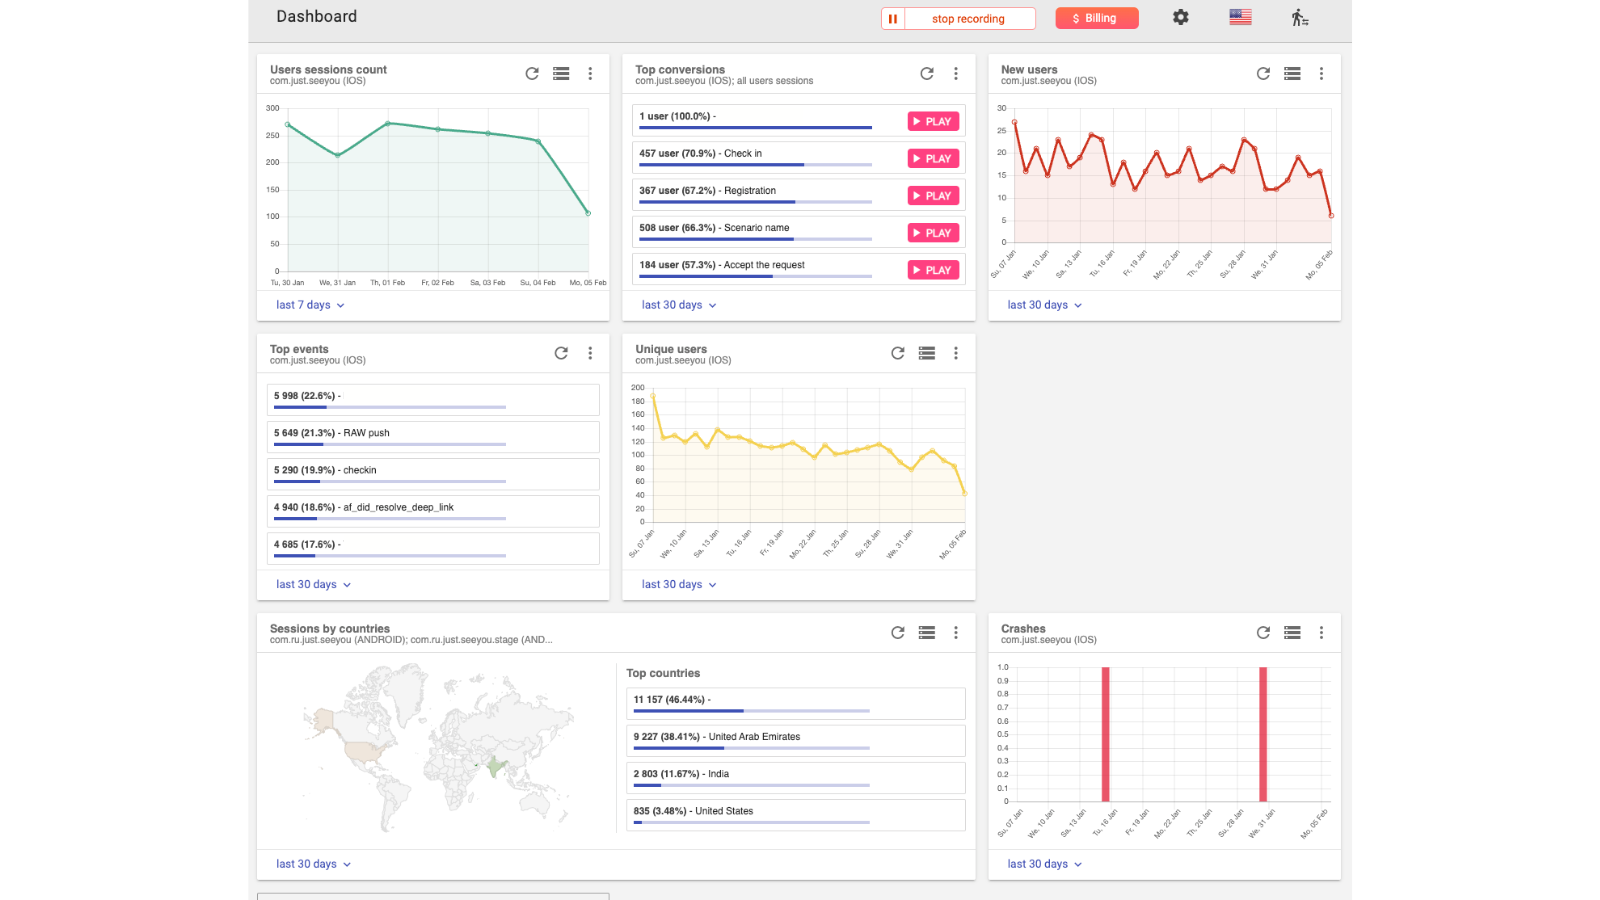
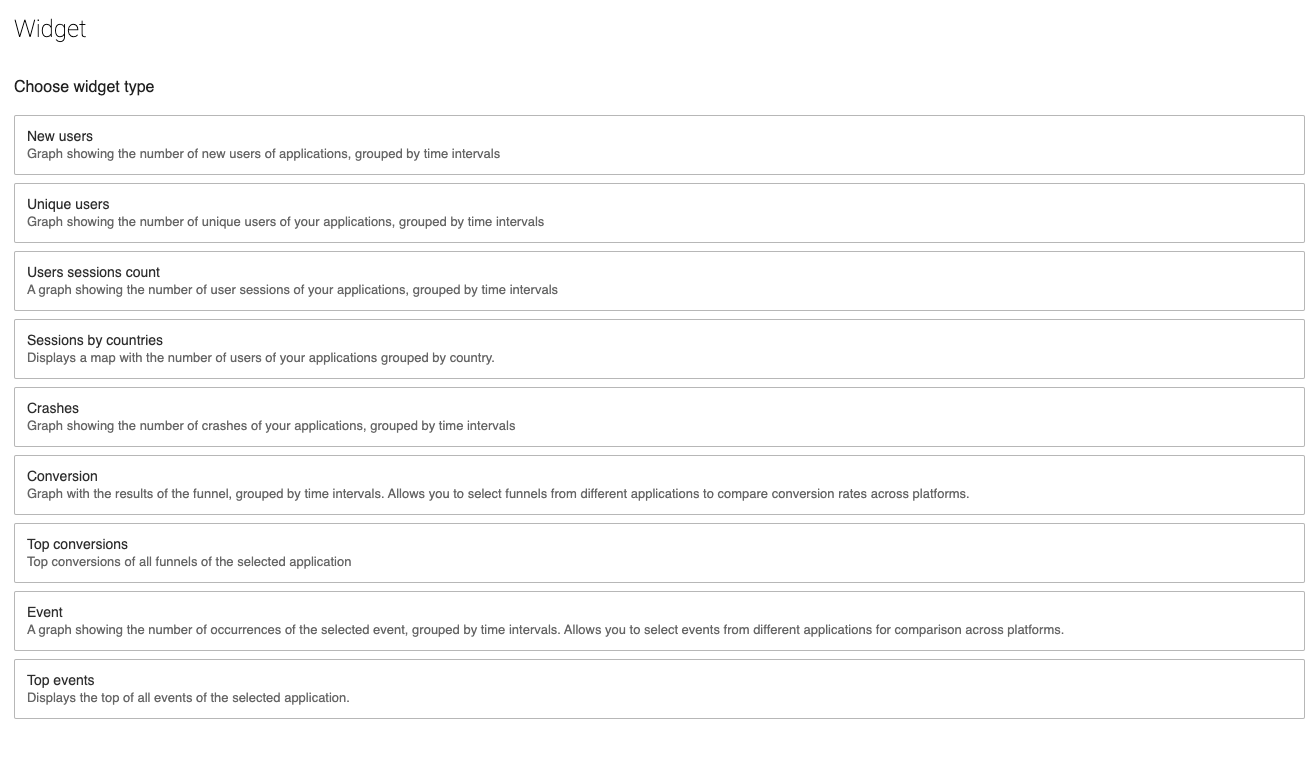
Examples of customer experience dashboards for mobile app analytics typically focus on various aspects of the user's interaction with an app, from initial download to ongoing engagement and feedback. Below are detailed examples illustrating different types of customer experience dashboards, each tailored to specific aspects of the mobile app user experience:
Book a demo and try UserX for frr
A customer experience dashboard is crucial for several reasons, especially in today's digital landscape where user satisfaction and engagement directly influence a business's success. Here are key reasons why a customer experience dashboard is important:
- Real-time Insights: Dashboards provide real-time insights into how users interact with an app, allowing businesses to quickly identify and address issues that could negatively impact the user experience. This immediate feedback loop is essential for maintaining a high level of service quality.
- Data-driven Decisions: With comprehensive analytics at their fingertips, businesses can make informed, data-driven decisions rather than relying on guesswork. This leads to more effective strategies for improvement and innovation within the app.
- Enhanced User Satisfaction: By continuously monitoring key metrics such as user engagement, retention rates, and feedback, companies can proactively make adjustments to enhance user satisfaction. Happy users are more likely to remain loyal customers, recommend the app to others, and contribute to positive growth through increased usage and purchases.
- Identifying Trends and Patterns: Dashboards help in spotting trends and patterns in user behavior over time. Understanding these trends enables businesses to anticipate user needs, tailor content, features, and functionalities accordingly, and stay ahead of competitors.
- Optimizing User Journey: Analyzing the paths users take within the app helps in identifying friction points or bottlenecks that hinder conversion or engagement. Businesses can use this information to streamline the user journey, making it more efficient and enjoyable for the user.
- Measuring Impact of Changes: When updates or new features are rolled out, a customer experience dashboard can measure their impact on the user experience. This feedback is crucial for iterating on the app in a way that continually improves its value to users.
- Fostering a User-centric Culture: Embedding the use of a customer experience dashboard within an organization promotes a user-centric culture. It keeps the focus on the user's needs and experiences, encouraging teams across the organization to prioritize user satisfaction in their work.
- Cost Efficiency: By identifying and resolving user experience issues early, businesses can reduce the costs associated with customer service inquiries, negative feedback, and churn. Investing in improving the user experience upfront can lead to significant cost savings over time.
- Enhanced Brand Reputation: A superior customer experience is a key differentiator in crowded markets. By leveraging a dashboard to optimize this experience, companies can enhance their brand reputation, attract new users, and maintain a competitive edge.
In summary, a customer experience dashboard is an indispensable tool for businesses that are serious about understanding and improving the way users interact with their mobile apps. It not only aids in enhancing the user experience but also supports broader business objectives such as increasing user retention, driving growth, and fostering a positive brand perception.
Using customer experience dashboards effectively involves a series of steps designed to help you understand user interactions, identify areas for improvement, and make informed decisions to enhance the overall user experience. Here are the key steps along with a short description of each:
1. Define Objectives
- Description: Clearly define what you want to achieve with the dashboard. Objectives may include improving user satisfaction, increasing engagement, reducing churn rates, or optimizing conversion funnels.
2. Identify Key Metrics
- Description: Select metrics that align with your objectives. These could include engagement metrics (e.g., session duration, frequency of visits), performance indicators (e.g., load times, error rates), and user feedback scores (e.g., NPS, CSAT).
3. Integrate Data Sources
- Description: Ensure your dashboard can pull in data from various sources relevant to the customer experience, such as app analytics platforms, customer feedback tools, and CRM systems.
Integrating data sources for a customer experience dashboard using UserX features involves combining insights from app analytics and UX analytics. UserX offers advanced analytics capabilities such as session recordings, heatmaps, and conversion funnels, which allow for a comprehensive view of the user journey. These tools enable businesses to pull in diverse data types, offering a holistic understanding of user interactions, preferences, and issues, thus ensuring that the dashboard reflects all aspects of the customer experience.
4. Customize Dashboard Views
- Description: Tailor the dashboard to show the most relevant data for different users or teams within your organization. Custom views can help focus on specific aspects of the user experience, such as performance, engagement, or feedback.
5. Analyze Data Regularly
- Description: Regularly review the data presented in the dashboard to identify trends, patterns, and anomalies. Set aside time for periodic reviews to ensure continuous monitoring of the user experience.
6. Share Insights Across Teams
- Description: Distribute dashboard insights with stakeholders and teams across the organization. Sharing data promotes a user-centric culture and ensures that decisions are informed by actual user experience metrics.
7. Take Action Based on Insights
- Description: Use the insights gained from the dashboard to implement changes aimed at improving the user experience. This could involve optimizing app performance, adjusting features, or addressing user feedback directly.
8. Measure the Impact of Changes
- Description: After making changes, use the dashboard to track their impact on the user experience. Look for improvements in the key metrics you've identified as indicators of success.
9. Iterate and Improve Continuously
- Description: Customer experience is an ongoing process. Use the dashboard to continuously iterate and improve the app based on user feedback and changing needs.
10. Train Your Team
- Description: Ensure that team members know how to use the dashboard effectively. Training should cover how to interpret the data, identify actionable insights, and implement changes based on dashboard findings.
By following these steps, you can leverage customer experience dashboards to gain a deep understanding of how users interact with your app, enabling you to make informed decisions that enhance the user experience and contribute to the success of your app.
Customer Experience (CX) dashboards, like those enabled by UserX, are essential tools for understanding and optimizing the mobile app user journey. They offer a comprehensive view of user interactions, satisfaction, and behavior through advanced analytics features such as session recordings, heatmaps, and conversion funnels. By integrating data from various sources, CX dashboards empower businesses to make data-driven decisions, enhance user satisfaction, and ultimately drive growth and retention. UserX stands out by providing detailed insights into the app user experience, facilitating targeted improvements and strategic decision-making.
